> ## Documentation Index
> Fetch the complete documentation index at: https://docs.botbrains.io/llms.txt
> Use this file to discover all available pages before exploring further.
# Ticketing Performance
> Measure AI involvement and autonomous resolution in Zendesk and Salesforce ticketing workflows
The **Ticketing** view on your [metrics dashboard](https://platform.botbrains.io/~/metrics) covers ticketing channels-Zendesk and Salesforce. Unlike chat, ticketing workflows expect human-AI collaboration. Use the channel filter to compare Zendesk and Salesforce performance, and the label filter to segment by customer tier or product area.
## Why Involvement Rate, Not Resolution Rate
In chat, the AI either resolves a conversation or it doesn't-Resolution Rate captures this cleanly. In ticketing, human finishing is a normal, valuable outcome. A ticket where the AI drafts a response and a human sends it still saved significant agent time, but Resolution Rate counts this as a failure of autonomy.
Every ticket falls into one of two buckets: **involved** (the AI participated) or **not involved** (the AI didn't participate). Within involved tickets, three levels describe *how* the AI participated:
| Level | What happens | Customer sees AI? |
| -------------- | ------------------------------------------------------------------------------------ | ----------------- |
| **Autonomous** | The AI handled the entire ticket without any human intervention | Yes |
| **Public** | The AI generated customer-visible responses, then a human also participated | Yes |
| **Private** | The AI suggested responses internally, but a human sent all customer-facing messages | No |
```mermaid theme={null}
graph TD
A[All Tickets] --> B[Involved]
A --> C[Not Involved]
B --> D[Autonomous]
B --> E[Public]
B --> F[Private]
style A fill:#f5f5f5
style B fill:#e1f5ff
style C fill:#f5f5f5
style D fill:#e8f5e9
style E fill:#e1f5ff
style F fill:#f3e5f5
```
**Involvement Rate** counts all three levels together-it tells you what share of tickets the AI touches at all. **Relative Autonomous Rate** narrows the lens to just involved tickets and measures how many the AI handled fully on its own. Together they answer: "Does the AI participate?" and "When it does, how often does it resolve tickets without help?"
## Single metrics
| Card | Description | Interpretation |
| ------------------------ | ------------------------------------------------------------------------------------------ | -------------------------------------------------------------------- |
| Involvement Rate | Percentage of tickets where the AI participated (autonomous, public, or private) | 80%+ means the AI assists with most tickets |
| Involved Tickets | Absolute count of tickets with AI participation, with trend comparison | Multiply by average handling time to estimate agent hours saved |
| Relative Autonomous Rate | Percentage of AI-involved tickets handled fully autonomously (excludes human-only tickets) | 60%+ indicates strong autonomous performance among involved tickets |
| Better Monday Score | Percentage of weekend tickets where the AI provided at least one customer-visible response | 70%+ means strong weekend coverage, reducing Monday morning backlogs |
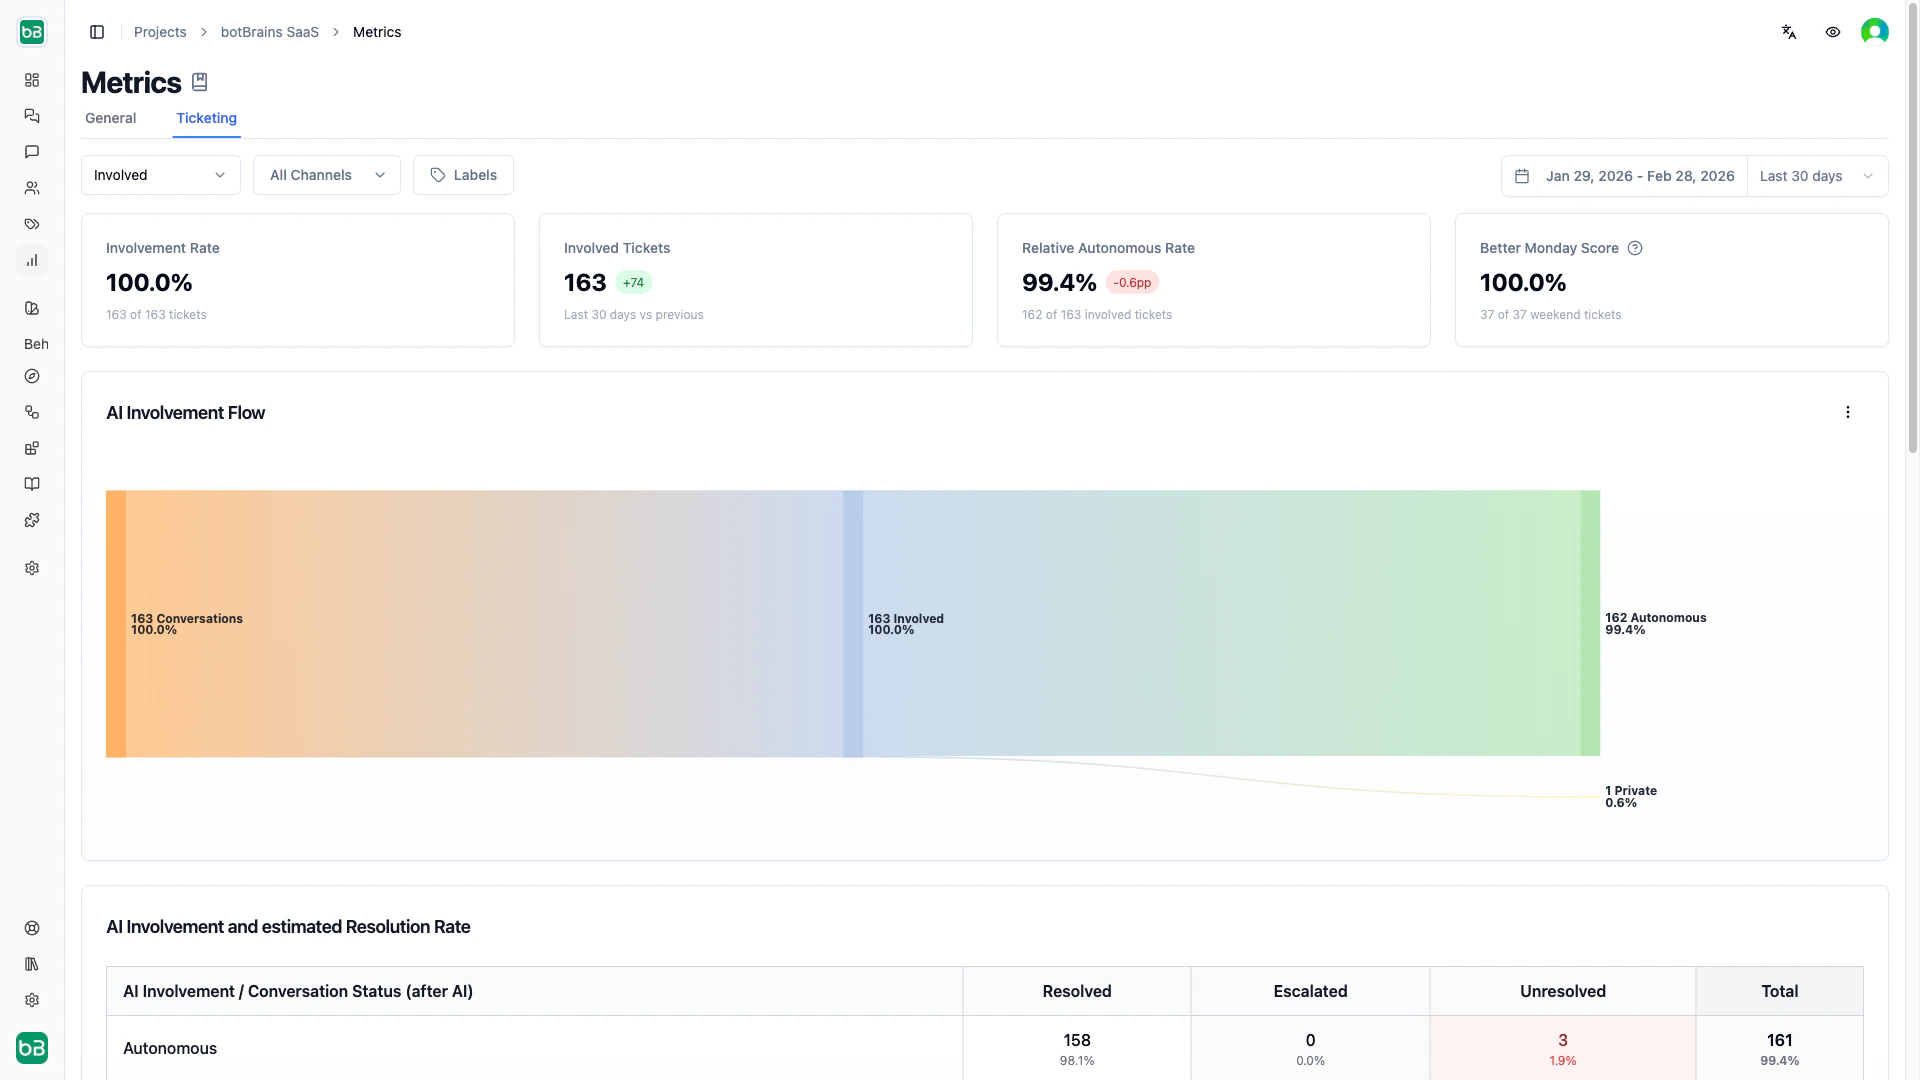 High involvement + low autonomy means the AI engages frequently but needs human finishing-focus on knowledge gaps. Low involvement + high autonomy means the AI is effective but underutilized-expand coverage to more ticket types.
**Autonomous Rate is provisional until a ticket closes.** A ticket counts as autonomous only while no human agent has sent a message on it. botBrains recomputes involvement on every reply, so it reclassifies the ticket the moment an agent steps in-a ticket that looks autonomous today becomes public tomorrow when a customer replies and an agent finishes the thread. Because recent windows contain many still-open tickets, their Relative Autonomous Rate starts high and settles downward as those tickets close. Read autonomous performance on windows that have had time to mature (last 30 days rather than today), and expect the most recent days to firm up over time.
## Charts and Use Cases
| Chart | Use case |
| -------------------------- | ------------------------------------------------------------------------------------------------------------------------------------------------------------------------------------------------------------------------------------------------------------------------------ |
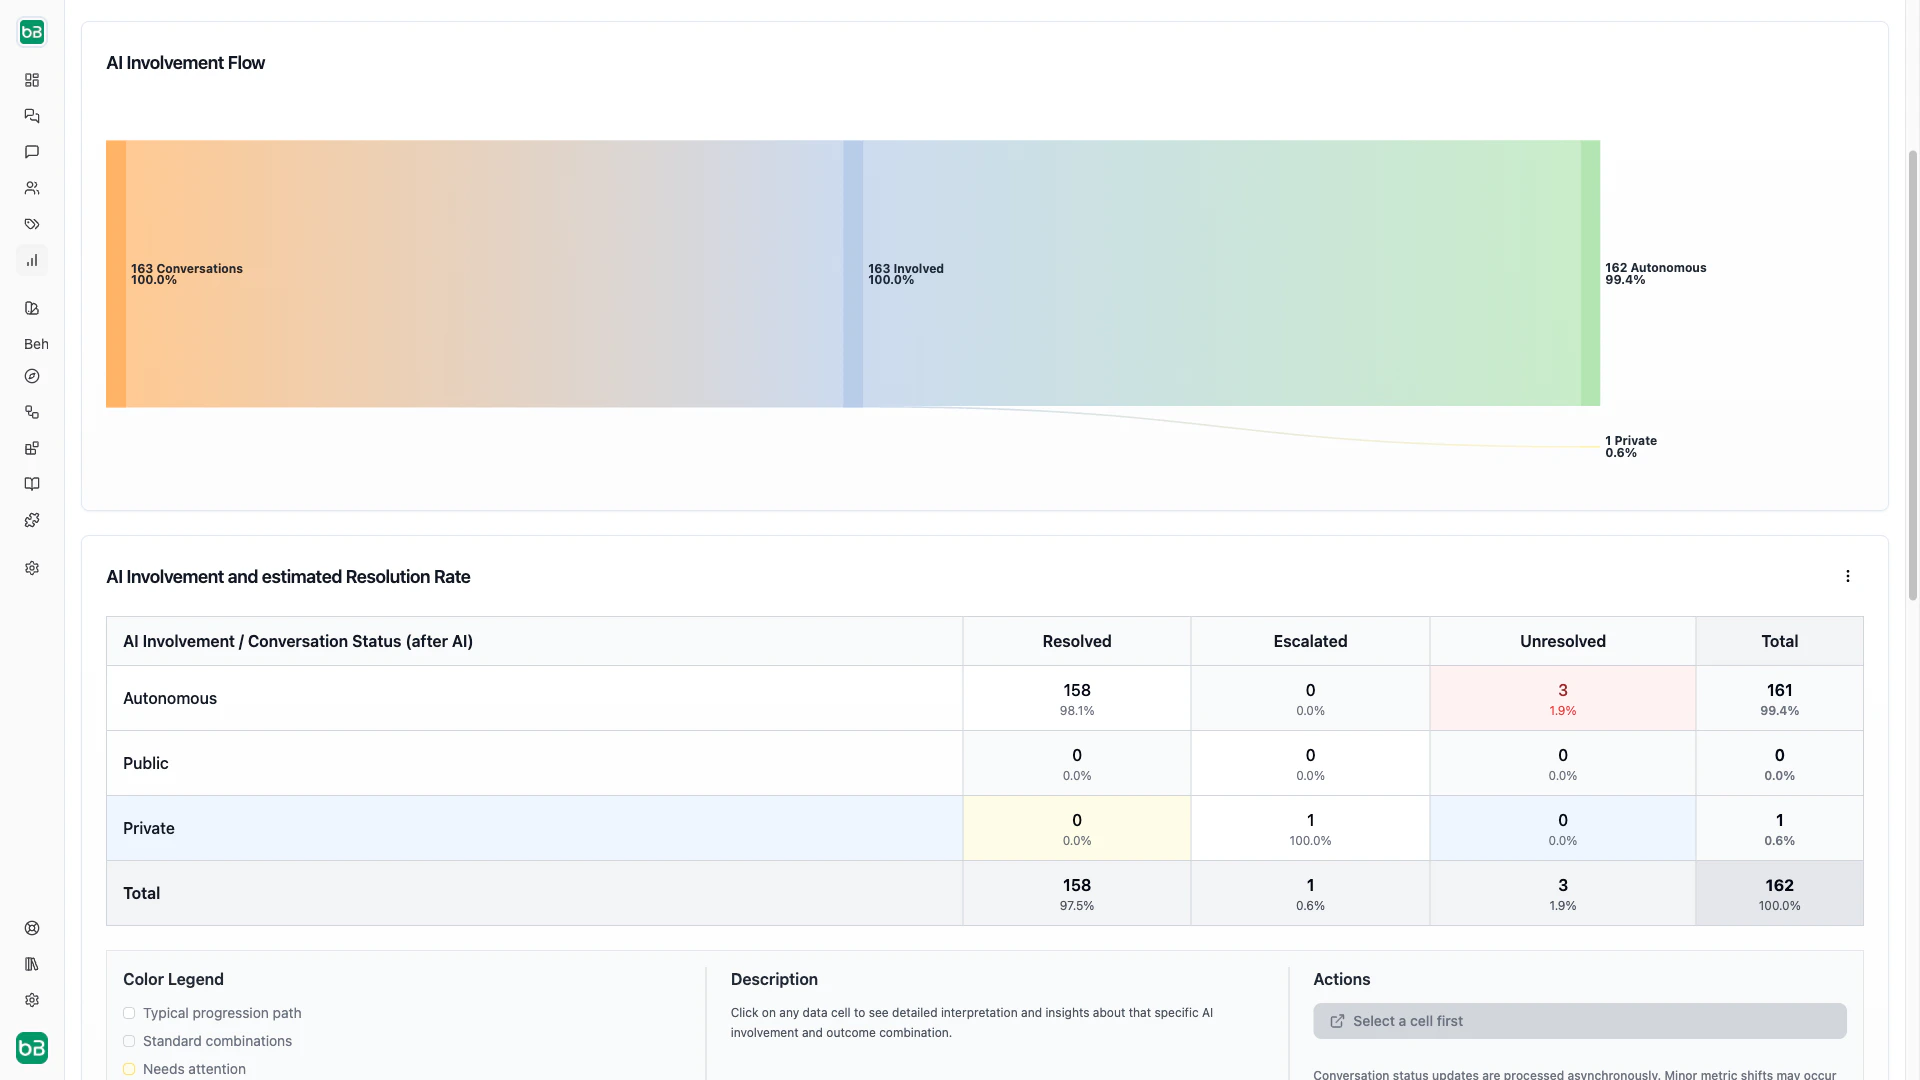
| Involvement Flow (Sankey) | Identify optimization paths. A wide **autonomous → escalated** flow reveals knowledge gaps to fix. Maximize the **autonomous → resolved** flow. A large **not involved** column means tickets the AI could handle. |
| AI Involvement vs. Success | Compare resolution rates across involvement types. If autonomous and public resolution rates are similar, humans aren't adding much-expand autonomous handling. High escalation in autonomous tickets means the AI correctly recognizes its limits but needs better knowledge. |
| Involvement Rate Over Time | Track adoption. Growing autonomous (green) and shrinking not-involved (gray) sections indicate improving coverage and knowledge. |
| Involvement Rate Evolution | Spot inflection points. Autonomous rising while public falls means the AI takes over tickets that previously needed human finishing. A plateau in the autonomous line signals you've hit current knowledge limits. |
High involvement + low autonomy means the AI engages frequently but needs human finishing-focus on knowledge gaps. Low involvement + high autonomy means the AI is effective but underutilized-expand coverage to more ticket types.
**Autonomous Rate is provisional until a ticket closes.** A ticket counts as autonomous only while no human agent has sent a message on it. botBrains recomputes involvement on every reply, so it reclassifies the ticket the moment an agent steps in-a ticket that looks autonomous today becomes public tomorrow when a customer replies and an agent finishes the thread. Because recent windows contain many still-open tickets, their Relative Autonomous Rate starts high and settles downward as those tickets close. Read autonomous performance on windows that have had time to mature (last 30 days rather than today), and expect the most recent days to firm up over time.
## Charts and Use Cases
| Chart | Use case |
| -------------------------- | ------------------------------------------------------------------------------------------------------------------------------------------------------------------------------------------------------------------------------------------------------------------------------ |
| Involvement Flow (Sankey) | Identify optimization paths. A wide **autonomous → escalated** flow reveals knowledge gaps to fix. Maximize the **autonomous → resolved** flow. A large **not involved** column means tickets the AI could handle. |
| AI Involvement vs. Success | Compare resolution rates across involvement types. If autonomous and public resolution rates are similar, humans aren't adding much-expand autonomous handling. High escalation in autonomous tickets means the AI correctly recognizes its limits but needs better knowledge. |
| Involvement Rate Over Time | Track adoption. Growing autonomous (green) and shrinking not-involved (gray) sections indicate improving coverage and knowledge. |
| Involvement Rate Evolution | Spot inflection points. Autonomous rising while public falls means the AI takes over tickets that previously needed human finishing. A plateau in the autonomous line signals you've hit current knowledge limits. |
 ## Identifying Issues
**Convert public involvement to autonomous.** Filter the Sankey diagram to public → resolved. Review what information humans added that the AI lacked. Extract those patterns into your knowledge base. Monitor whether those ticket types shift to autonomous → resolved.
**Reduce Monday backlog.** Check the Better Monday Score. If it's below 50%, filter to unanswered weekend tickets and review them by topic. Add knowledge for the most common weekend inquiry types and consider less aggressive escalation rules outside business hours.
**Find topics the AI can't handle alone.** Filter the Sankey to autonomous → escalated and group by topic on the [topics dashboard](https://platform.botbrains.io/~/topics). Decide for each topic: add knowledge (if information gap), create specific escalation rules (if legitimately complex), or improve guidance (if judgment issue).
**Measure ROI.** Multiply the Involved Tickets count by your average ticket handling time to estimate agent hours saved. For a more precise calculation, use the Relative Autonomous Rate to isolate tickets that needed zero human time.
Don't optimize Involvement Rate or Better Monday Score at the expense of answer quality. A high score with poor responses frustrates customers. Monitor CSAT alongside automation metrics.
## Next Steps
* [Metrics](/concepts/metrics) - Return to the dashboard overview and cross-channel comparison
* [Conversations](/concepts/conversations) - Drill into individual tickets to understand metric patterns
* [Topics](/concepts/topics) - Segment ticket performance by topic
* [Improve Answers](/guides/improve-answers) - Use ticket insights to refine knowledge
* [Data Providers](/concepts/data-providers) - Add knowledge to increase autonomous resolution
## Identifying Issues
**Convert public involvement to autonomous.** Filter the Sankey diagram to public → resolved. Review what information humans added that the AI lacked. Extract those patterns into your knowledge base. Monitor whether those ticket types shift to autonomous → resolved.
**Reduce Monday backlog.** Check the Better Monday Score. If it's below 50%, filter to unanswered weekend tickets and review them by topic. Add knowledge for the most common weekend inquiry types and consider less aggressive escalation rules outside business hours.
**Find topics the AI can't handle alone.** Filter the Sankey to autonomous → escalated and group by topic on the [topics dashboard](https://platform.botbrains.io/~/topics). Decide for each topic: add knowledge (if information gap), create specific escalation rules (if legitimately complex), or improve guidance (if judgment issue).
**Measure ROI.** Multiply the Involved Tickets count by your average ticket handling time to estimate agent hours saved. For a more precise calculation, use the Relative Autonomous Rate to isolate tickets that needed zero human time.
Don't optimize Involvement Rate or Better Monday Score at the expense of answer quality. A high score with poor responses frustrates customers. Monitor CSAT alongside automation metrics.
## Next Steps
* [Metrics](/concepts/metrics) - Return to the dashboard overview and cross-channel comparison
* [Conversations](/concepts/conversations) - Drill into individual tickets to understand metric patterns
* [Topics](/concepts/topics) - Segment ticket performance by topic
* [Improve Answers](/guides/improve-answers) - Use ticket insights to refine knowledge
* [Data Providers](/concepts/data-providers) - Add knowledge to increase autonomous resolution