

For ticketing channels (Zendesk, Salesforce), see Ticketing Performance. Ticketing uses different primary metrics because human finishing is an expected part of the workflow.
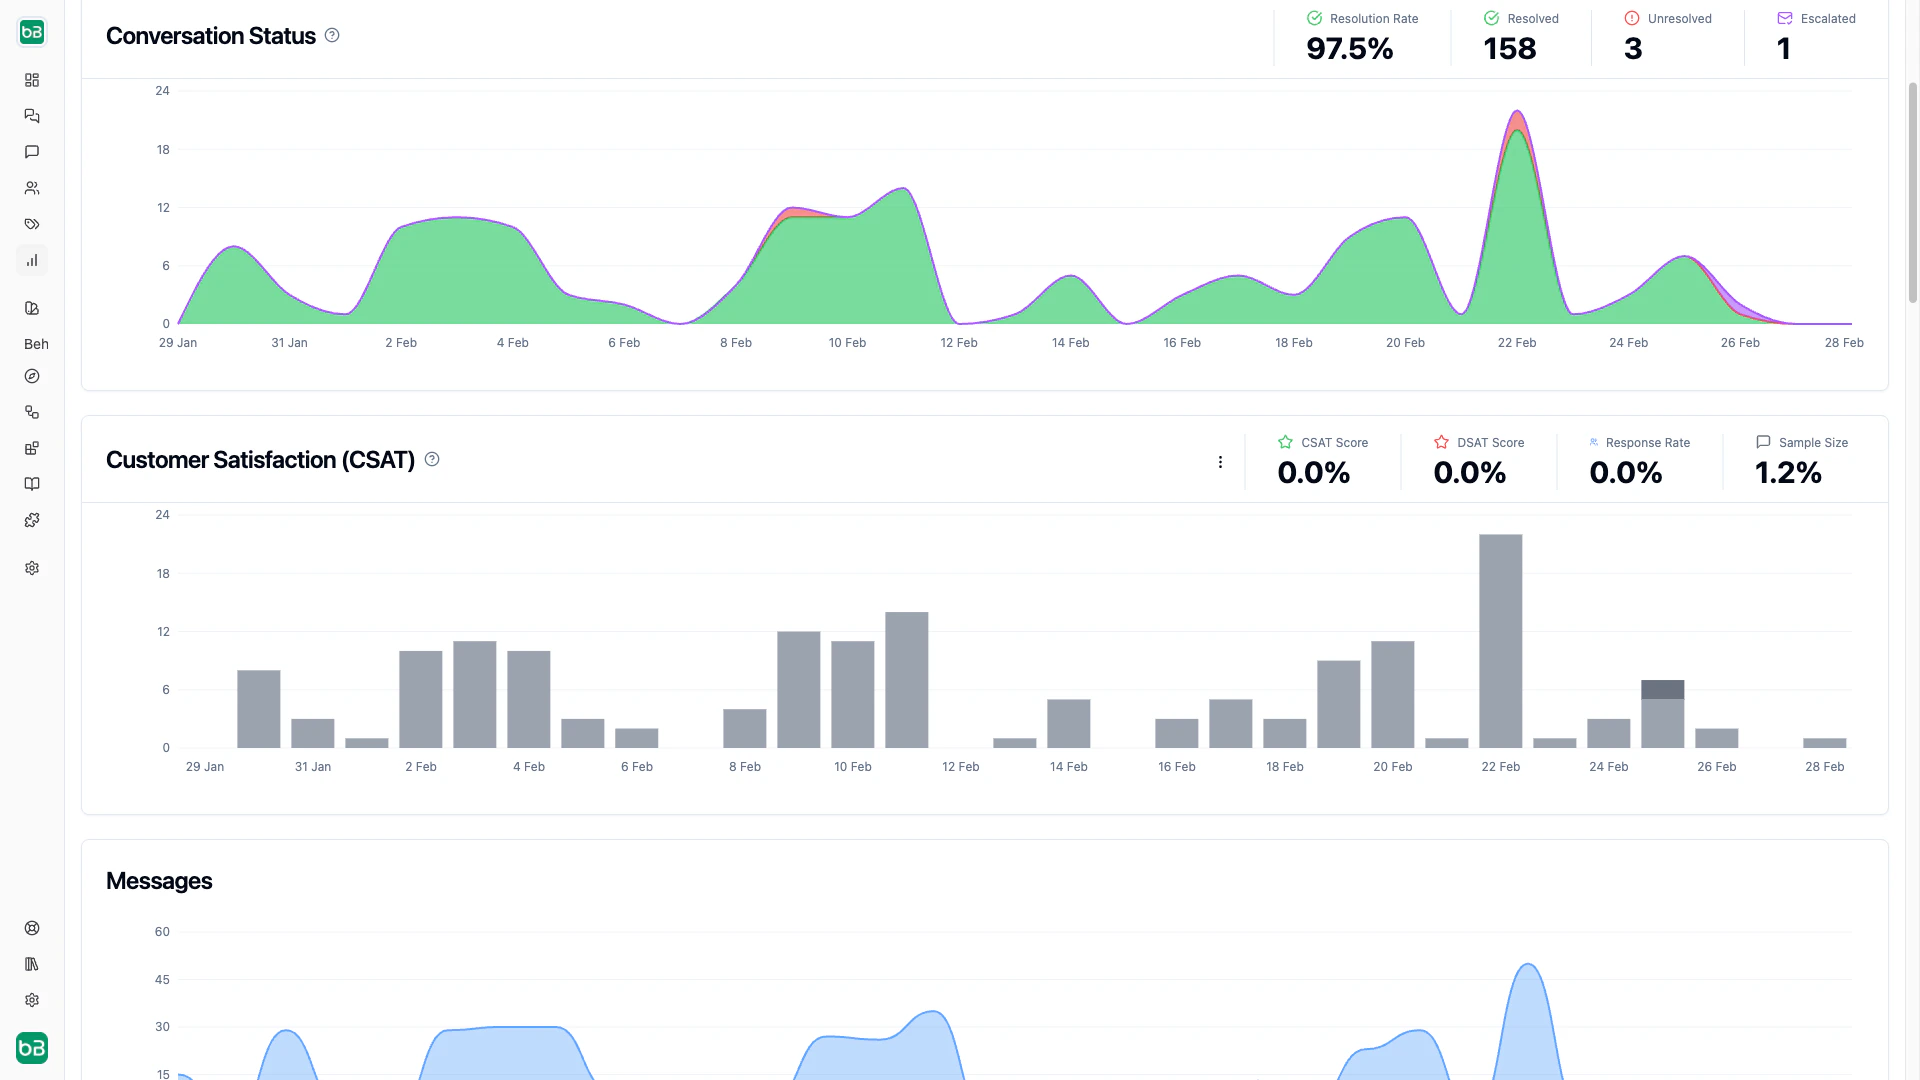
Conversation Status
Every conversation has a status that indicates how it concluded.Metrics
Charts and Use Cases
Identifying Issues
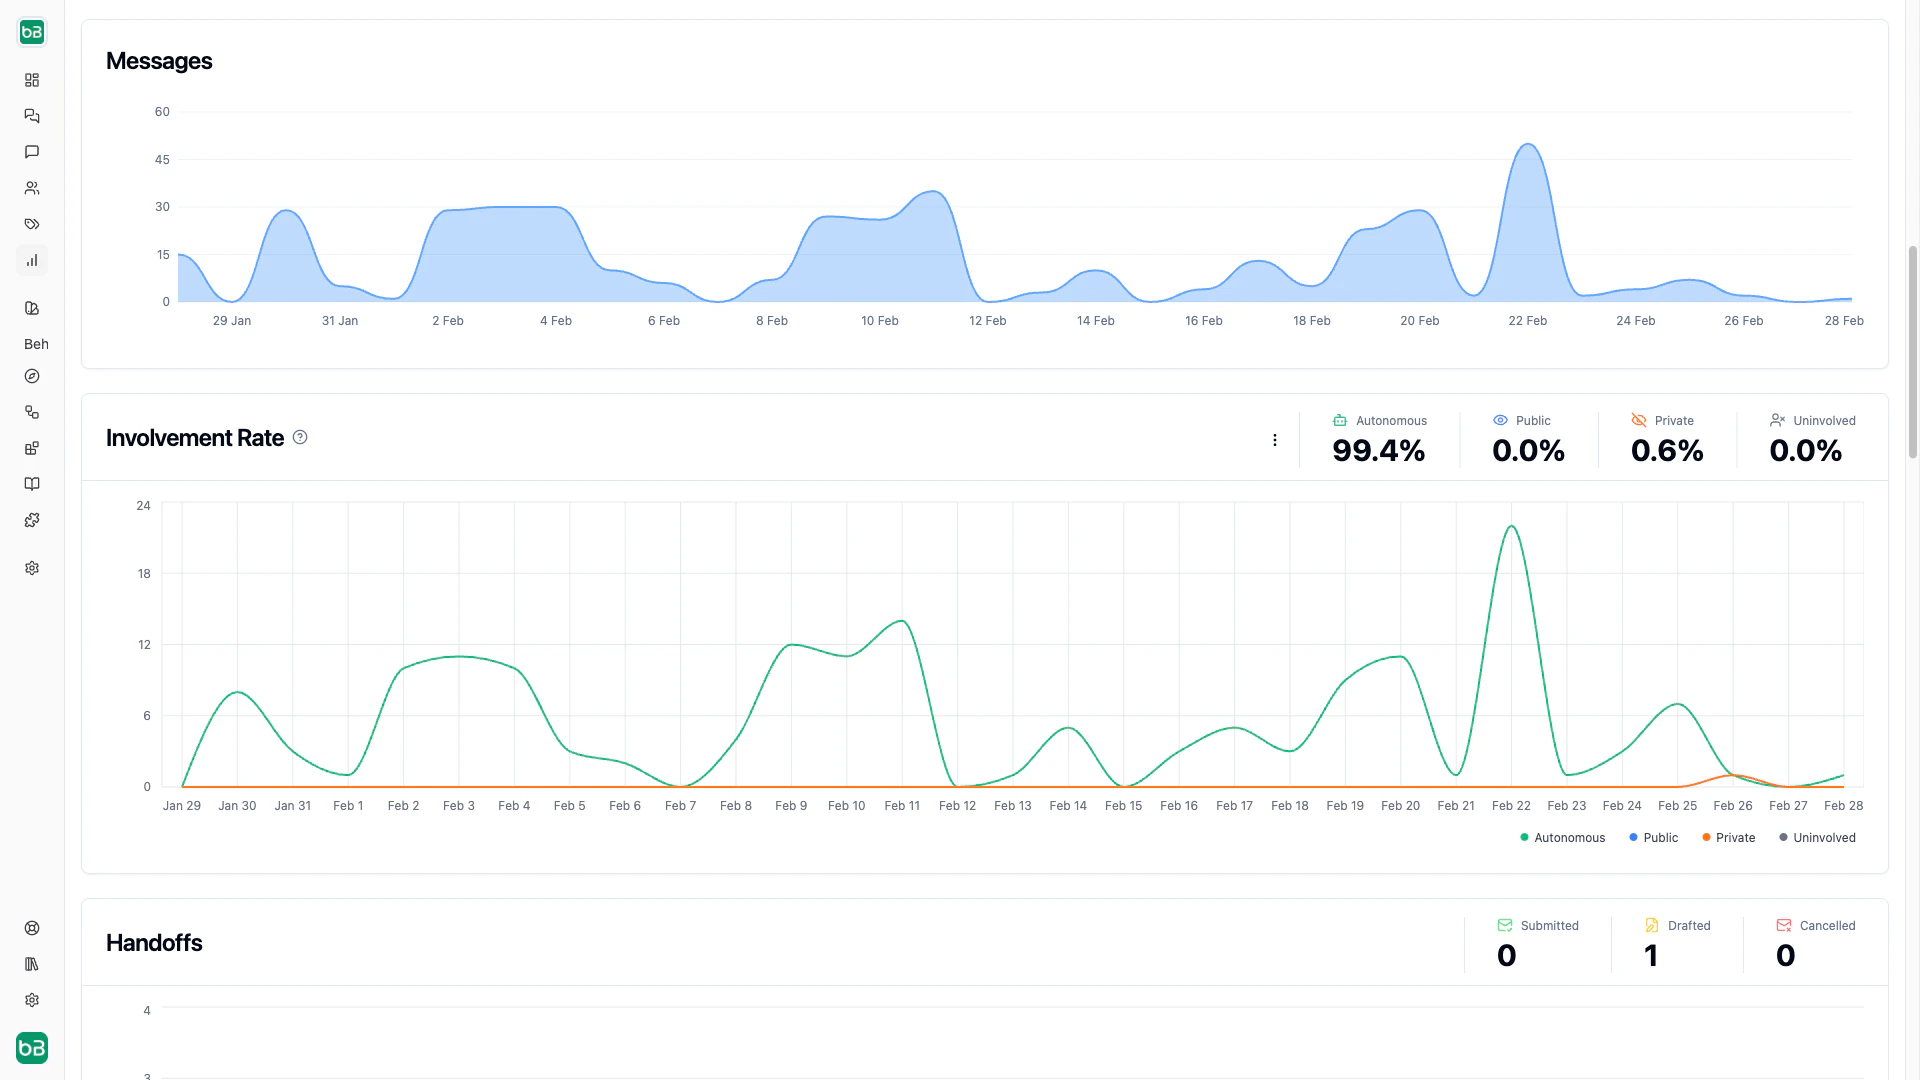
Find topics with low satisfaction. Filter conversations by topic and rating 1–2 to see where the AI struggles most. Cross-reference with the Resolution Status chart on the topics dashboard to quantify the problem. Spot knowledge gaps. The Answer Completeness chart shows how often the AI has no answer at all. Open those conversations and check the source attribution-”Used Sources (0)” means the AI fell back to general knowledge instead of your data. Create snippets to fill the gap. Understand escalation patterns. The handoff chart reveals when and why the AI escalates. Filter to escalated conversations and review whether escalations were necessary (complex issue) or avoidable (missing knowledge). Reduce avoidable escalations by adding the missing information. Track improvement after changes. After updating knowledge or guidance, use the date range filter to compare the affected topic’s metrics before and after. Look for rising resolution rates and CSAT on that topic.Next Steps
- Conversations - Review individual conversations to understand metrics in context
- Ticketing Performance - Compare chat metrics to ticketing performance
- Topics - Segment performance by topic to find improvement areas
- Improve Answers - Use insights to refine knowledge and guidance