How TopicAI Works
TopicAI automatically analyzes your conversations and groups them into meaningful categories on a recurring schedule:- Nightly categorization. Every night, TopicAI assigns the most relevant topics to all conversations based on semantic similarity.
- Weekly discovery. Every Monday morning, TopicAI scans recent conversations to detect emerging patterns and creates new topic categories.
- Topic finalization. Conversations older than the most recent Monday have stable topic assignments, while recent conversations may be recategorized as the model improves.
Activating Topics
Open the topics page and request TopicAI activation. Once activated, choose how to guide the analysis:
Seed topics don’t constrain what the system can detect. They guide how specific or broad the categories should be. The system discovers additional topics automatically over time.
Initial topic detection takes a few minutes. The model stabilizes over 1–2 weeks as it processes more conversations.
Using the Topics Dashboard
The topics dashboard helps you answer specific questions about your AI’s performance by topic. Use the date range, channel, and label filters at the top to narrow the analysis.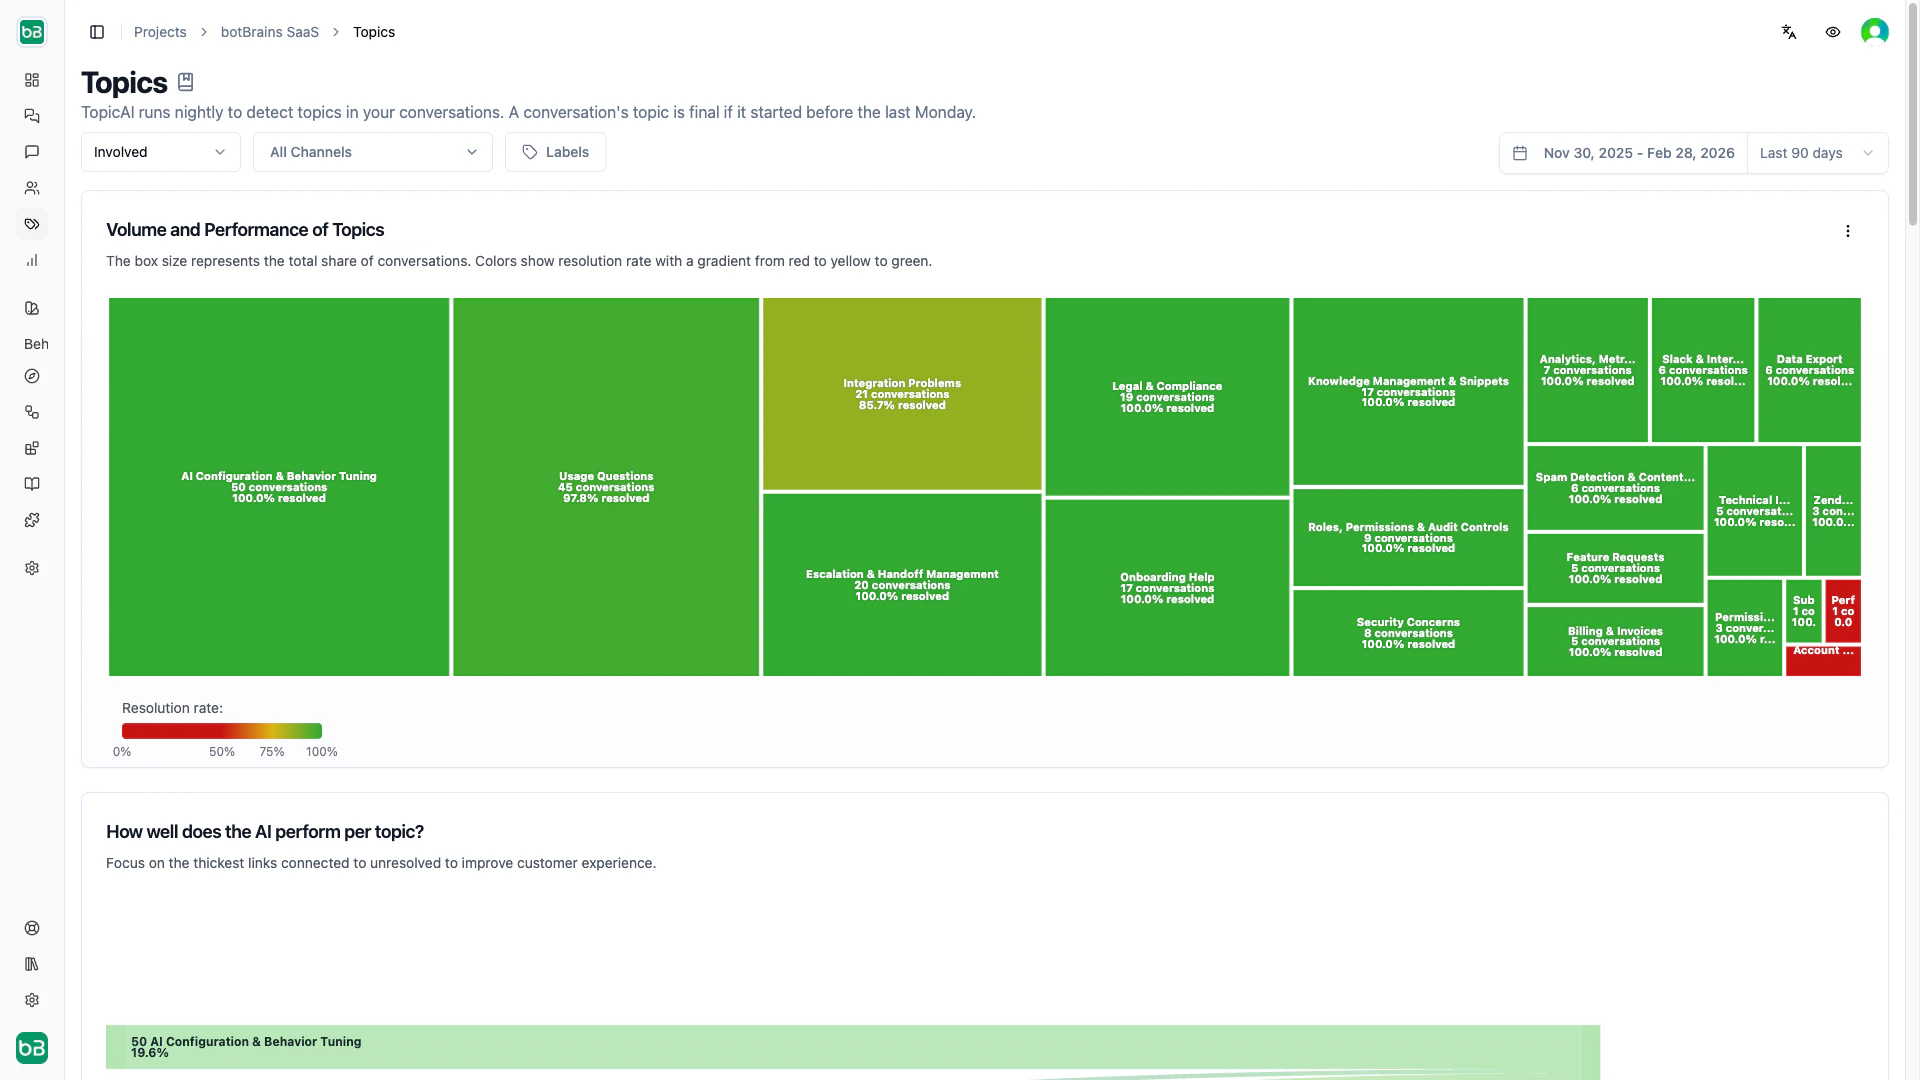
Find topics that need attention first
The Resolution treemap gives you an at-a-glance priority map. Rectangle size indicates conversation volume, color indicates resolution rate (green = high, red = low). Start with large red boxes. They represent high-volume topics where the AI struggles most.See where conversations go wrong
The Resolution Sankey connects each topic to its resolution outcomes (resolved, escalated, unresolved). Look for wide flows into “escalated” or “unresolved” to find topics that need better knowledge or escalation rules.Track how your topic mix changes over time
The Trend Chart combines a donut chart (overall distribution) with a weekly bar chart (volume over time). Toggle between absolute numbers and relative percentages to spot shifts in topic mix or emerging trends.Find topics the AI doesn’t handle autonomously
The Involvement Sankey maps topics to AI involvement levels (autonomous, public, private, not involved). Topics with low autonomy are candidates for better knowledge or guidance.Browsing all topics
The Topic Table lists every topic with its conversation count, percentage share, and trend badge. Click the arrow icon to view a topic’s conversations. Click the pencil icon to edit a topic’s title or description.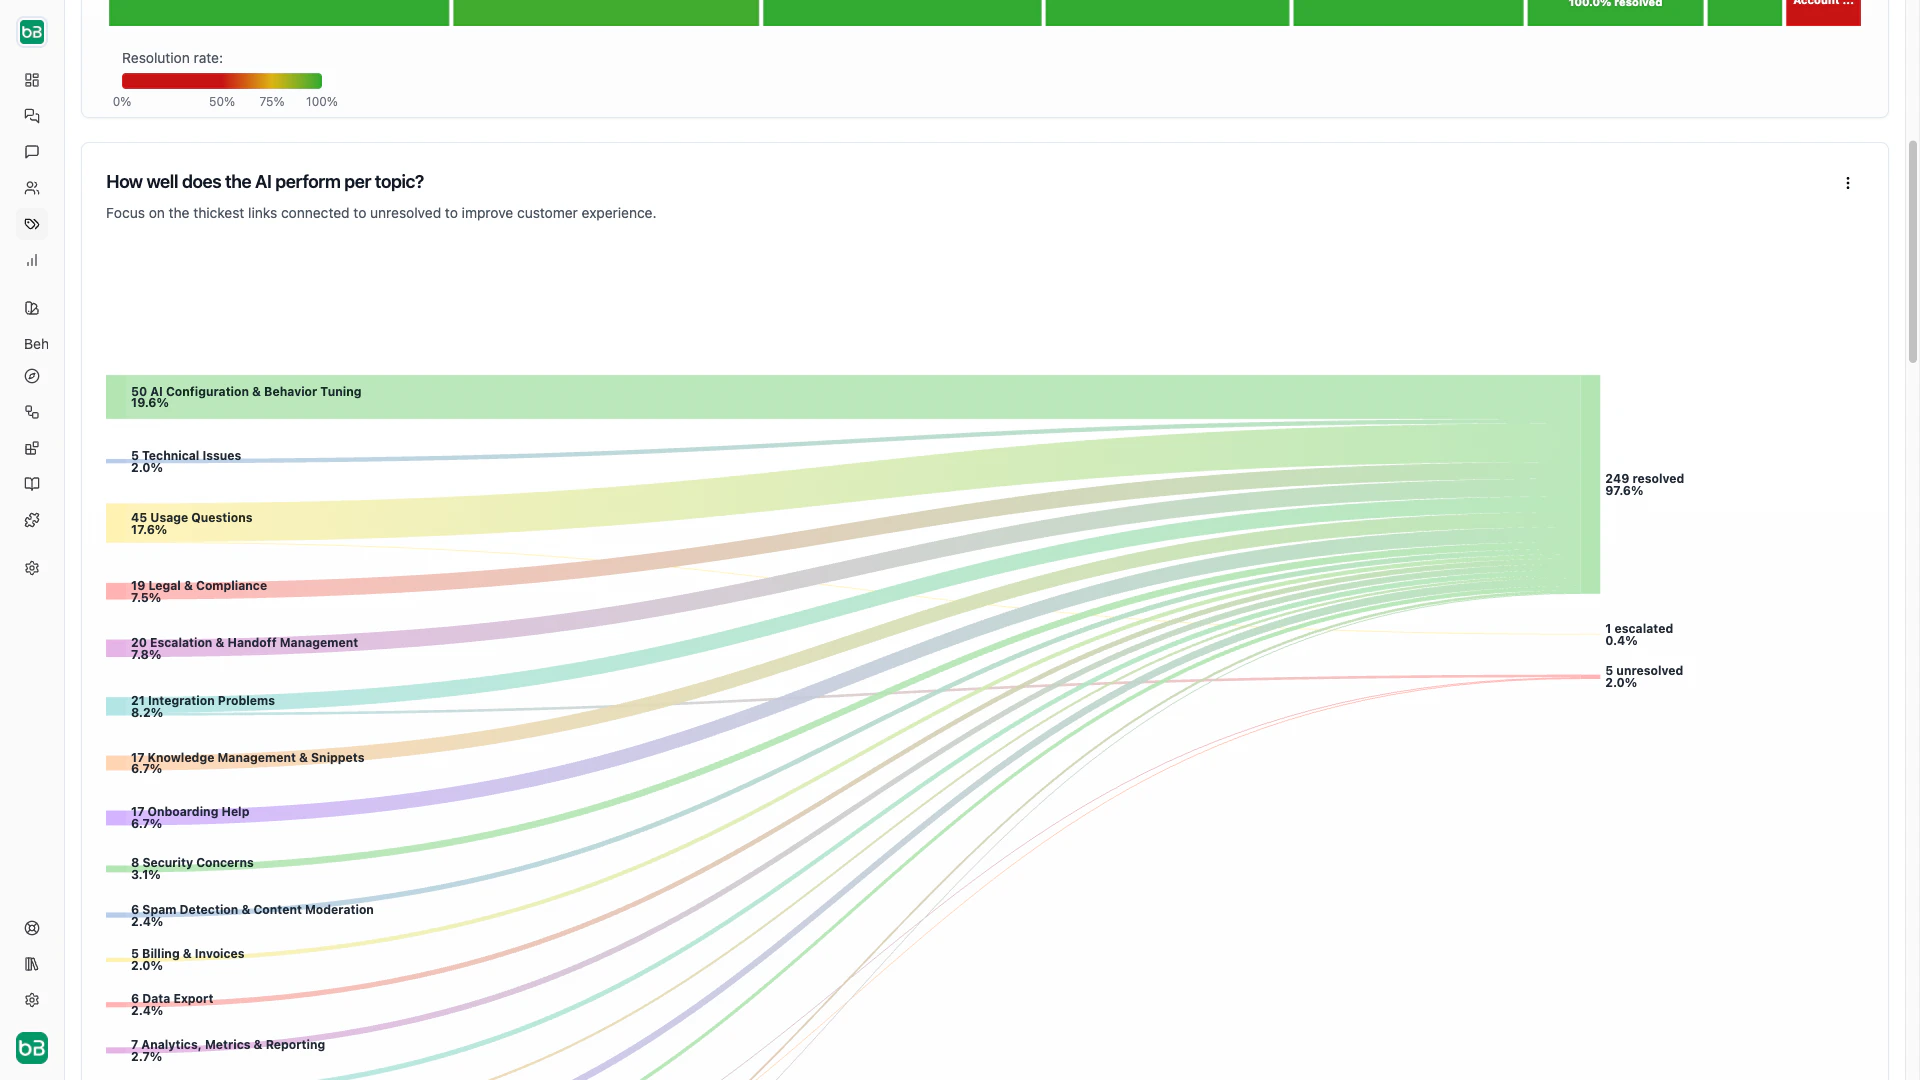
Managing Topics
Click Create Topic in the topic table to add a new topic with a title and description. Edit any existing topic by clicking the pencil icon. The system applies changes during the next nightly categorization run, or you can use Categorize Now to run it immediately. Use Find New Topics to trigger topic discovery on demand instead of waiting for the weekly Monday run.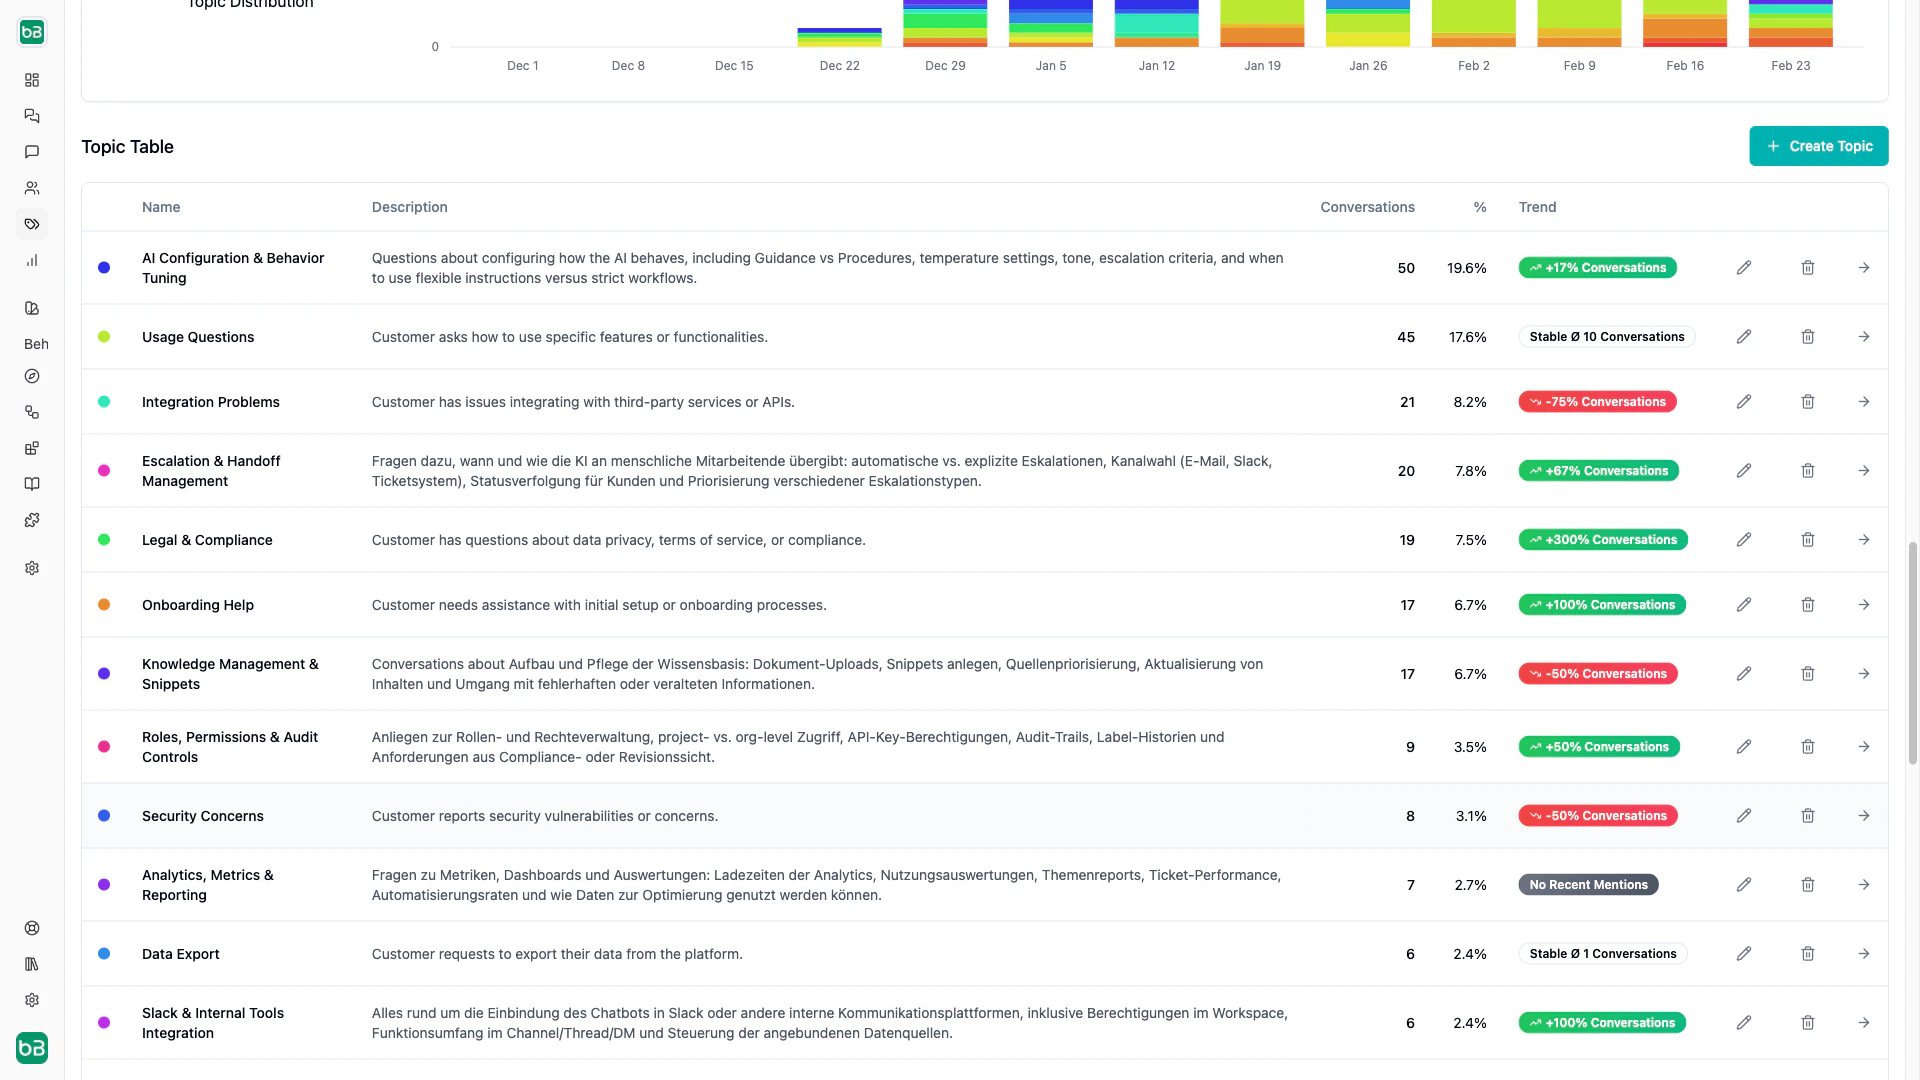
Next Steps
- Metrics - Analyze CSAT and resolution rates segmented by topic
- Data Providers - Fill knowledge gaps identified through topic analysis
- Labels - Combine manual labels with automatic topics
- Improve Answers - Use topic insights to refine your AI’s responses