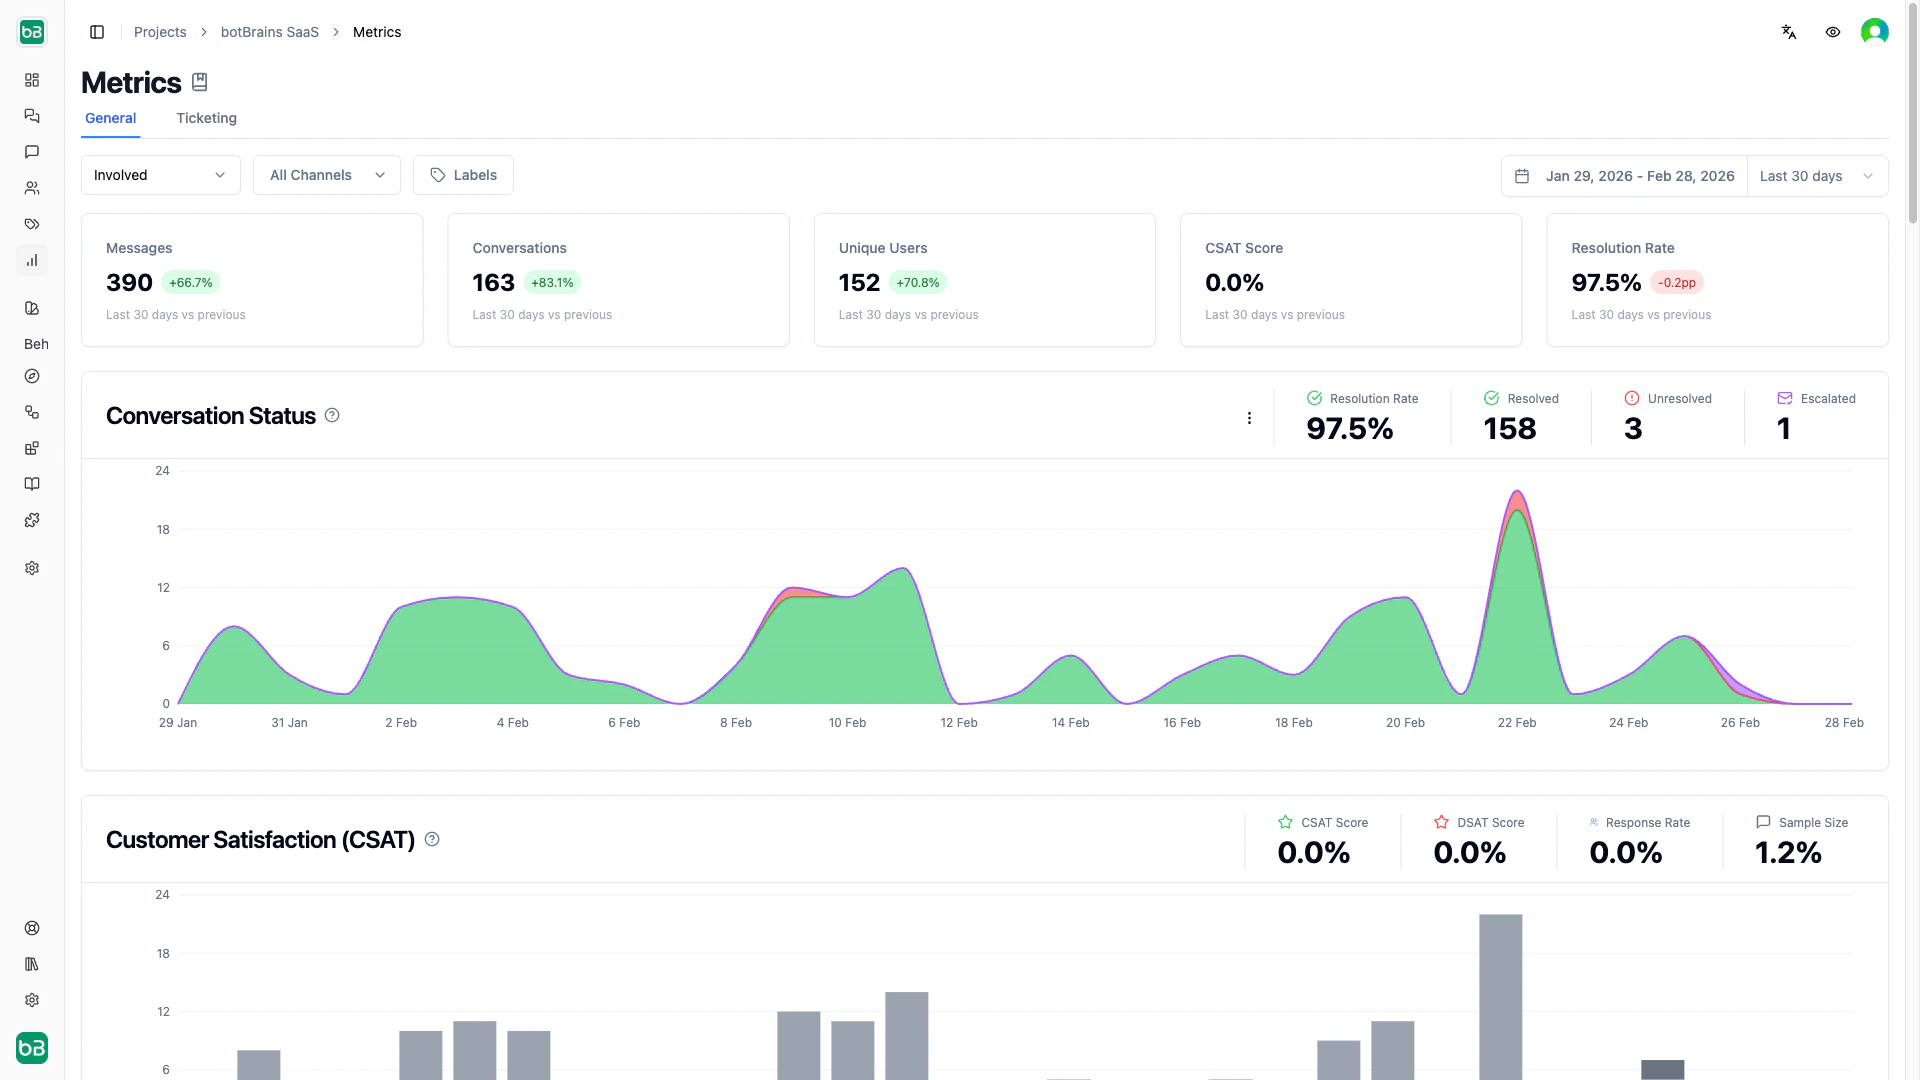
Your metrics dashboard transforms raw conversation data into actionable performance insights. Instead of guessing how well your AI performs, you get concrete numbers that show what’s working, what needs improvement, and how changes affect your customer experience. Open the metrics dashboard to view your performance analytics. The dashboard provides two views — General and Ticketing — that you can switch between using the tabs at the top of the page. For deeper analysis, explore the dedicated performance pages:

Filters

All metrics respect your filter selections. Use the date range (top right) to control the time window — trend indicators automatically compare to the equivalent previous period. Use the channel and label filters to segment by communication channel or conversation tags.
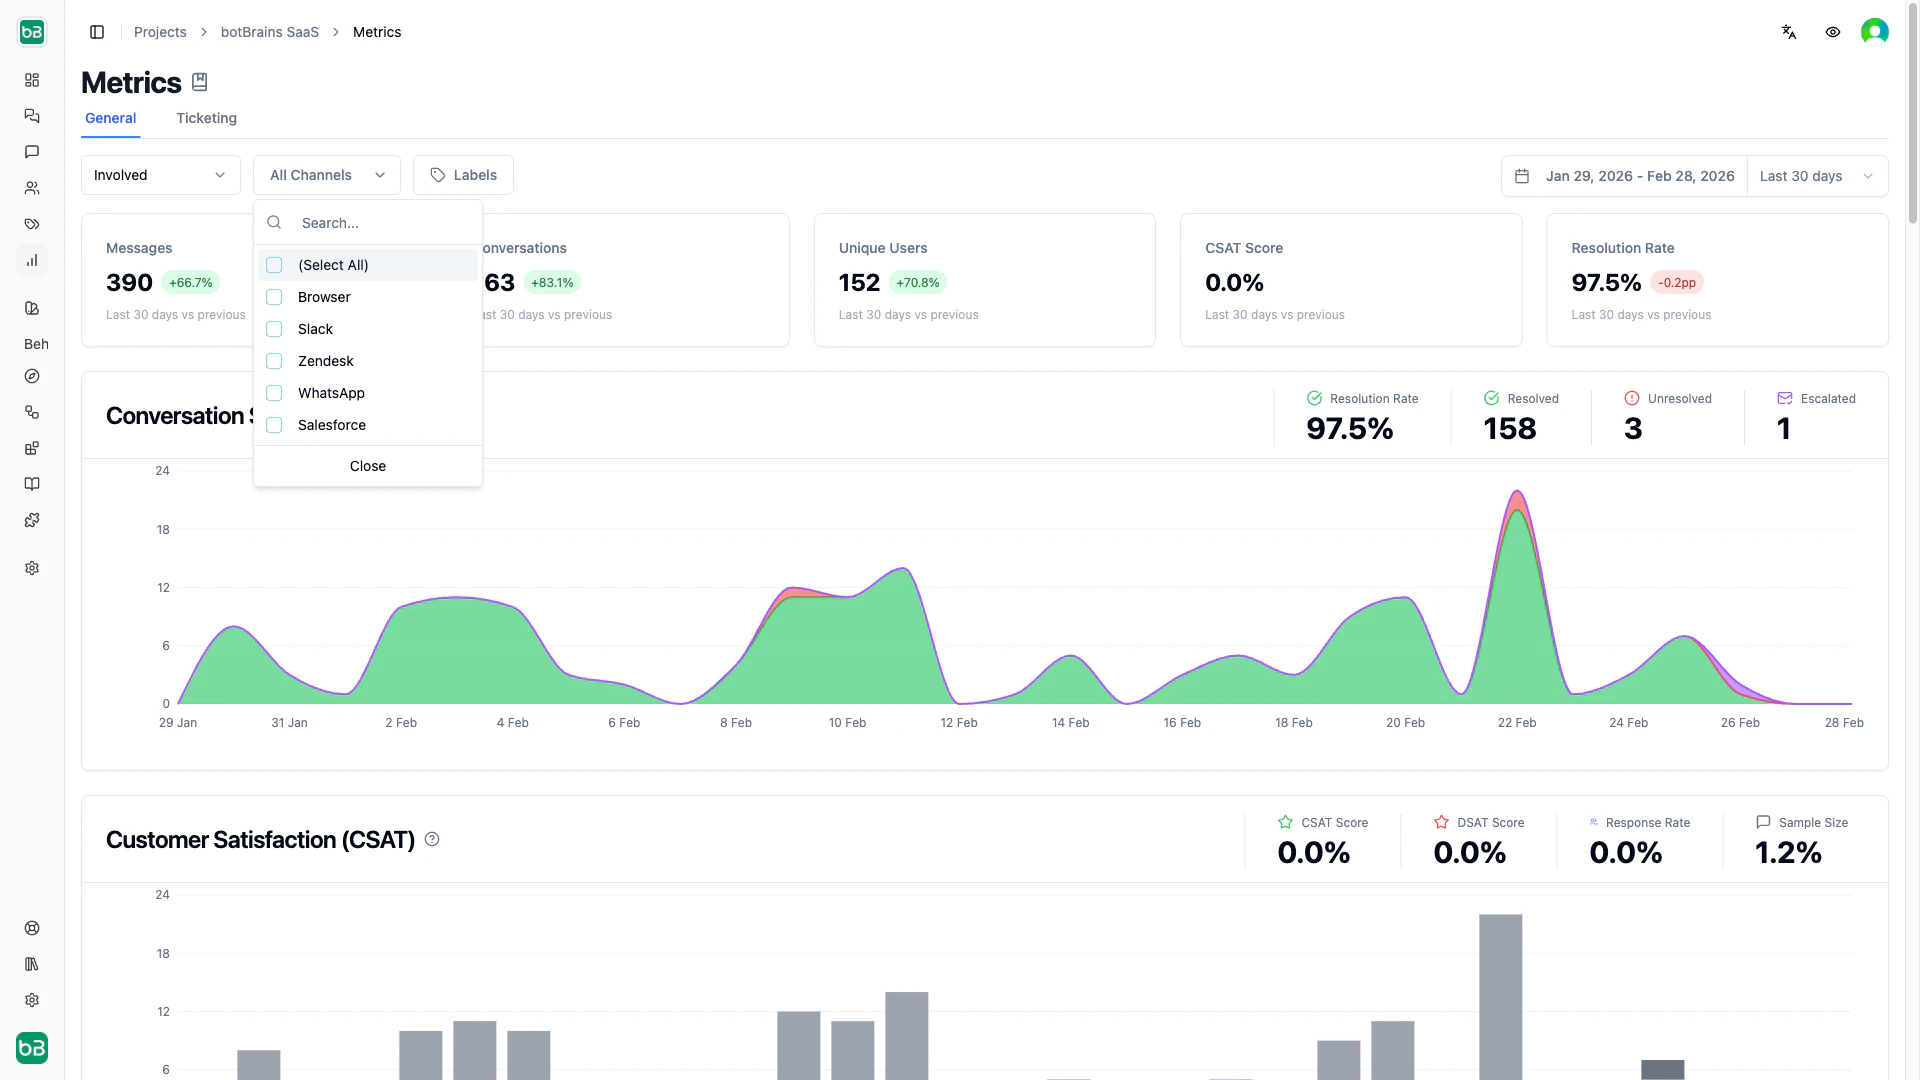
General View Metrics

The General view provides an overview of your AI’s performance across all conversation types.

Overview Cards

NameDescriptionInterpretation
MessagesTotal messages exchanged (user + AI) in the selected timeframeRising messages with stable conversations means longer discussions
ConversationsUnique conversation threads started during the timeframeSpikes may indicate product issues or marketing campaigns
Unique UsersDistinct users who started conversations (counted once even with multiple conversations)Compare to conversation count to gauge repeat contact rate
CSAT ScorePercentage of satisfied customers (4–5 star ratings) out of all rated conversations80%+ is excellent, below 60% needs urgent attention
Resolution RatePercentage of conversations resolved without escalation or abandonment80%+ indicates strong autonomous performance

Charts

NameDescriptionInterpretation
Conversation StatusStacked area chart breaking down conversations into resolved, unresolved, and escalated over timeTrack resolution trends and correlate status changes with deployments or knowledge updates
Conversation RatingHistogram showing distribution of customer ratings (1–5 stars, abandoned, unoffered)A healthy distribution peaks at 4–5 stars with a small tail at 1–2 stars (under 10%)
Message VolumeArea chart showing total messages and total conversations over timeAverage messages per conversation reveals complexity — 2–4 is quick, 9+ suggests struggles
AI Involvement RatePie chart categorizing conversations by AI participation: fully autonomous, public involvement, private involvement, not involvedTarget 60–70% fully autonomous for a mature deployment
HandoffVisualization of when and why the AI handed conversations to human agentsIdentify peak handoff times and topics that frequently need human intervention
Answer CompletenessPie chart showing complete, incomplete, and no-answer responsesHigh “no answer” percentage points directly to knowledge gaps you should fill
User SentimentBar chart showing positive, neutral, and negative sentiment distributionRising negative sentiment with low CSAT means users are frustrated with the AI’s responses
User Rating TrendLine chart tracking rating distribution (1–5 stars) over timeUpward-sloping 4–5 star lines confirm sustained improvement
User LanguageHorizontal bar chart showing which languages users communicate inSignificant non-English traffic with low satisfaction signals a need for multilingual knowledge
Usage by PageHorizontal bar chart showing which pages generated conversations (web chat)High-traffic pages suggest opportunities for better self-service content or page-specific knowledge
Knowledge Source UsageHorizontal bar chart showing which data providers the AI references mostDetect underutilized knowledge sources and prioritize updates to frequently used ones
Conversation LengthHistogram of message counts per conversationMany single-message conversations may mean users aren’t engaging; 9+ messages may mean the AI isn’t resolving efficiently
Activity HeatmapsWeekly and yearly calendar heatmaps of conversation volumeIdentify peak support hours for staffing and find seasonal patterns
Hidden ConversationsPie chart showing spam, blocked, and visible conversationsEnsure spam detection isn’t too aggressive and track abuse patterns

Ticketing View Metrics

The Ticketing view focuses on AI involvement in support ticket workflows.

Overview Cards

NameDescriptionInterpretation
Involvement RatePercentage of tickets where the AI participated (autonomous, public, or private)80%+ means the AI is assisting with most tickets
Involved TicketsAbsolute count of tickets with AI participation, with trend comparisonCalculate time saved: involved tickets times average handling time
Relative Autonomous RatePercentage of AI-involved tickets handled fully autonomously (excludes human-only tickets)60%+ indicates strong autonomous performance among involved tickets
Better Monday ScorePercentage of weekend tickets where the AI provided at least one customer-visible response70%+ means strong weekend coverage, reducing Monday morning backlogs

Charts

NameDescriptionInterpretation
Involvement Flow (Sankey)Flow diagram showing ticket paths from involvement level (autonomous, public, private, not involved) to outcome (resolved, escalated, unresolved)Maximize autonomous-to-resolved flow; investigate autonomous-to-escalated paths for improvement opportunities
AI Involvement vs. SuccessPivot table showing resolution outcomes across involvement levels with counts and percentagesCompare resolution rates across involvement types — if autonomous matches public, consider increasing autonomous handling
Involvement Rate Over TimeStacked bar chart showing involvement distribution across time periodsGrowing autonomous (green) and shrinking not-involved (gray) indicate improving adoption and knowledge
Involvement Rate EvolutionMulti-line chart with separate trend lines per involvement typeAutonomous rising while public falls means the AI is successfully taking over tickets that previously needed human finishing

Next Steps

  • Chat Performance - Deep dive into conversation quality and satisfaction
  • Ticketing Performance - Detailed analysis of AI involvement in ticketing
  • Conversations - Review individual conversations to understand metric context
  • Topics - Segment metrics by topic to find specific improvement areas
  • Improve Answers - Use metric insights to refine knowledge and guidance